
Introduction
Dear readers,
In this post, we’ll explore how to investigate web browsers during a security incident. Browsers are often the first interactive point of contact between users and the internet, making them a common vector for initial compromise (either by visiting a suspicious website, downloading a malicious file or using a harmful extension). Investigating them can provide critical insights into how an attack was initiated and what data may have been exposed.
In this post, we’ll walk through the different steps to perform a browser-based investigation.
1. What artifacts should you collect?
Each browser stores a variety of data that can be useful during an investigation. Depending on the browser (Chrome, Firefox, Edge, etc.) you should look for:
- Browsing History: very important information, reveals user navigation and potential malicious URLs
- Download History: shows potential malicious file downloaded
- Cookies: can indicate session hijacking or tracking
- Sensitive data stored: may be targeted or stolen
- Extensions/Add-ons: potential source of malicious code
- Session Data (Tabs, Sessions, etc.): to help reconstruct user activity
2. Automating Artifact Collection with Powershell on Windows assets
Here we go, the first step is to find a way to collect the different elements we may need. Rather than manually retrieving all the files, we’ll use a Powershell script.
Find the Powershell script on my GitHub and execute it on the target device: https://github.com/gash-rgb/main/blob/master/PS_Scripts/DFIR_WebBrowser_Artefacts.ps1

Tips for Microsoft Defender for Endpoint users:
You can use the Live Response feature to execute the script remotely (and on-demand). The benefit of this method is that we can retrieve information directly from our EDR without using deployment tools that are sometimes owned by other internal teams. It’s efficient and fast. Everything we need during a security incident.
Steps :
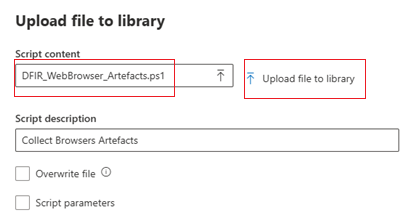
- Upload the script to the library : Endpoint > Initiate Live Response Session > Upload file to library
2. Validate that the script was well uploaded and ready to use by typing:
libraryYou should be able to see the name of the script in the output.
3. Execute the script on the target device by typing:
run DFIR_WebBrowser_Artefacts.ps14. At the end of the execution, the script generates an archive file in C:\Temp, be sure that the ZIP is present:
dirThen download it by typing:
getfile Browser_Artifacts_date_hour.zip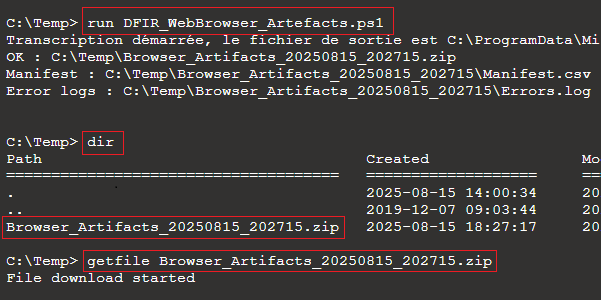
The archive contains all the artifacts needed for the investigation.
3. Analyzing the artifacts
Once collected, the artifacts are organized by user and by browser.
It is structured as follows:
- One folder per user and a manifest.csv (for tracking activity when collecting proofs)

- For each user, you will find one folder per web browser containing all the needed artifacts (Mozilla can contain several directories, it depends on the number of profiles):
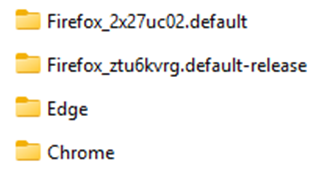
Each browser has its own structure.
Chrome and Edge (Chromium-based)
These browsers share a similar scheme (because both are chromium based), and store data in the following paths:
Edge: %AppData\Local\Microsoft\Edge\User Data\Default
Chrome: %AppData\Local\Google\Chrome\User Data\Default
Key files include:
- History
- Cookies
- Bookmarks
- Favicons
- Login Data
- Preferences
- Secure Preferences
- Top Sites
- Visited Links
- Web Data
- Extensions Folder
Mozilla Firefox
Firefox uses a different structure and store data in the following path (several profiles can be found):
Mozilla Firefox: %AppData\Roaming\Mozilla\Firefox\ProfilesKey files include:
- Places.sqlite
- Cookies.sqlite
- Extensions.json
- Favicons.sqlite
- Key4.db
- Permissions.sqlite
- Prefs.js
- Sessionstore.jsonlz4
- Logins.json
- Downloads.sqlite
Artifacts like browsing history, cookies, and form data can reveal visited websites, user behavior and interactions. It is crucial for understanding the context and drawing a big picture around the security incident.
Summary Table of Web Browser Artifacts :
| File | Browser | Description | Format |
|---|---|---|---|
| Cookies | Chrome / Edge | Stored HTTP/HTTPS cookies | SQLite |
| Bookmarks | Chrome / Edge | User-saved bookmarks | JSON |
| Favicons | Chrome / Edge | Icons of visited or bookmarked websites | SQLite |
| History | Chrome / Edge | Browsing history | SQLite |
| Login Data | Chrome / Edge | Stored credentials (encrypted) | SQLite |
| Preferences | Chrome / Edge | User settings and preferences | JSON |
| Top Sites | Chrome / Edge | Most visited websites | SQLite |
| Web Data | Chrome / Edge | Form data and credit card information; Autofill. | SQLite |
| Local State | Chrome / Edge | Global configuration and DPAPI keys | JSON |
| places.sqlite | Firefox | Browsing history and bookmarks | SQLite |
| favicons.sqlite | Firefox | Icons associated with visited or bookmarked websites | SQLite |
| cookies.sqlite | Firefox | Stored HTTP/HTTPS cookies | SQLite |
| logins.json | Firefox | Stored credentials (encrypted passwords) | JSON |
| key4.db | Firefox | Stored credentials (encrypted passwords) | SQLite |
| formhistory.sqlite | Firefox | History of filled forms | SQLite |
| permissions.sqlite | Firefox | Permissions granted to websites | SQLite |
| content-prefs.sqlite | Firefox | Site-specific preferences | SQLite |
| sessionstore.jsonlz4 | Firefox | Backup of open tabs and windows | JSON LZ4 |
| webappsstore.sqlite | Firefox | Local storage (DOM storage) | SQLite |
| storage/default/ | Firefox | IndexedDB and LocalStorage data per site | Dossiers + SQLite |
| cert9.db | Firefox | Certificates installed in the browser | SQLite |
| addonStartup.json.lz4 | Firefox | Installed extensions and their status | JSON LZ4 |
4.Viewing and Exploring SQLite Data
Browser data is structured and stored in SQLite and JSON formats. SQLite is a light database, serverless and is optimized for web browser. SQLite is open source and widely used in browsers world.
To explore the data, use a tool that can load SQLite. One of them, that I use, is DB Browser for SQLite (https://sqlitebrowser.org/). Once installed, give this guy any SQLite file and it will be able to show you the database structure, the table, index and the values.
Chrome/Edge (chromium-based) – Key Investigation point
File: History
An interesting file to explore during investigation is History. This file contains multiples tables including:
- downloads – List of all the files downloaded by the user with the following relevant column:
- current_path, referrertab_url, tab_referrer_url
- start_time
- downloads_url_chains – Less information than Downloads but list all the source URLs of download
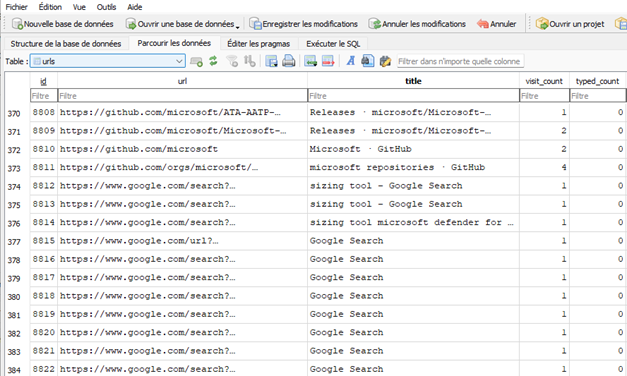
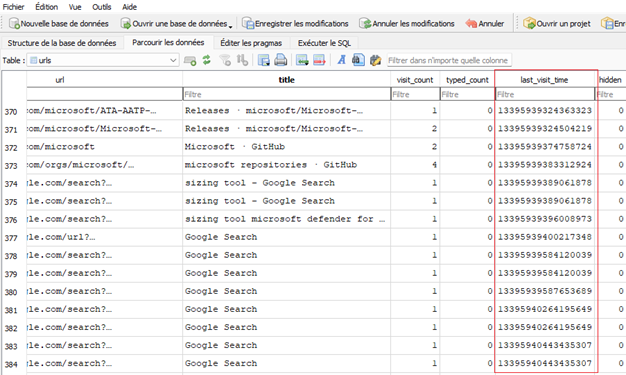
- urls – Chronology of all URLs visited during the current session. Relevant table:
- urltitle
- last_visit_time
One important aspect during investigation is the timestamp, one thing to note is that in the History file, the timestamp is not in a human readable format.
For example, in the last_visit_time column one of the the value is : 13395939324363323
The timestamp corresponds to a Webkit/Chrome Epoch Time format, which represents the number of microseconds since January 1, 1601, at 00:00:00 UTC. This format is used by Chromium-based browsers. To convert it you would need to:
- Divide the number by 1,000,000 to get seconds
- Then, add those seconds to the Epoch time: 1601-01-01 00:00:00 UTC
Why? The Gregorian calendar. For Windows NT, developers use 1601 as the start of a 400-year calendar cycle.
Surprising but worth knowing… You can use this online converter : WebKit/Chrome Timestamp Converter for one shot conversion or get a script for automatic conversion 😉
Understanding timestamps is crucial for building an accurate timeline
File: Preference
This is a JSON file and can be opened by classic text editor.
This file contains all the browser and user settings.
Mozilla Firefox – Key Investigation points
File: places.sqlite
An interesting file to check during investigation is places.sqlite. This file contains all the the files downloaded and websites visited by the user.
- Moz_places (contains information about navigation of the user)
- url
- last_visit_date
- moz_historyvisits (this table contains place_id that corresponds to the id field in the moz_places tables)
- moz_annos (download information)
The timestamp you will find in the different tables corresponds to the UNIX Epoch time. It represents the number of microseconds since January 1, 1970. Why ? Because Unix engineers “considered that it was a convenient date to work with”.
File: prefs.js
There is a file named prefs.js that is regrouping the user preferences for Firefox, this file can be check to identify some malicious or at least suspicious settings as :
- app.update.* : check if there is some unsual or blocked update
- browser.urlbar.* or browser.search.*: check if redirection to search engine was modified
- extensions.* : installed add-ons and their GUIDs
One thing to know, is that you can replicate the user’s environment by copying the profile folder into a lab machine. This can helps simulate behavior and test hypotheses.
5. Investigation of Web Extensions
Web extension is a common source of infection, according to MalwareBytes millions of people spied on by malicious browser extensions in Chrome and Edge. These extensions are mainly available in the official store. Attackers often publish benign extensions, wait for adoption, then… baam… push malicious updates. A malicious extensions can manipulate everything about your browser, exfiltrate your sensitive datas, redirect you to malicious URL, modify your web requests, modify your browser settings and more.
One way to investigate, is to look at the “Extensions” folder you previously extracted and look at the different extension IDs (it looks like a long string of alpha minus character).
For quick research, you can check directly in the store if the extension IDs exists :
- Edge : https://microsoftedge.microsoft.com/addons/detail/text/<put-the-extension-id-here>
- Chrome : https://chromewebstore.google.com/search//<put-the-extension-id-here>
- Mozilla Firefox : investigation is easier as in the JSON file the ID and the name can be seen in “addons” field. Also in “prefs.js”, there is a line resuming all the extension name with their GUID :
user_pref("extensions.webextensions.uuids", "{\"formautofill@mozilla.org\":\"d1cee9c9-e611-49b3-ac29-8f52ffb1ed8e\"As a general advice, for all suspicious extensions consider going deeper in analyzing the source code. The folder Extensions contains the source code of all extensions :
- Look at manifest.json for permissions
- Review .js files for suspicious behavior
- Finding out the sensitive data stored in the browser (and that can be stolen)
Browser autofill store a lot of privacy related data and knows a lot of information (names, login, emails, credit card number and more. Browser data is not safe.
In case of a browser infection, to prevent the attackers from using the different sensitive data of the user, we want to know what kind of data the attackers may have accessed.
Browsers store a surprising amount of personal data including :
Chrome/Edge (chromium-based)
Edge : %LocalAppData%/Microsoft/Edge/User Data/Default/Web Data
Chrome : %LocalAppData%/Google/Chrome/User Data/Default/Web Data- Autofill – List autofill done by the users (username, mail address, identifier, …)
- Credit_cards – List information related to credit cards
- Local_ibans – List IBANs stored in the browser
- Local_stored_cvc – List CVC stored in the browser
- And more..
Mozilla Firefox
Two files contains the passwords and stored logins :
Firefox : %LocalAppData\Roaming\Mozilla\Firefox\Profiles\<profilename>\logins.json
Firefox : %LocalAppData\Roaming\Mozilla\Firefox\Profiles\<profilename>\key4.db
Even if encrypted, these files indicate what data was stored and potentially accessible.
Identifying this helps assess the impact and guide remediation (password reset, block bank card, …)
Final words
Web browser investigation is a critical component of DFIR. Browsers hold a wealth of information about user behavior and their sensitive data. With the right tools and methodology, you can dig in and discover what’s going on.
Thanks !